Why Official Inflation Feels Wrong: What the CPI Actually Measures
The gap between reported inflation and what you feel is not imagination. CPI is a constructed model with specific assumptions, and every methodology revision since the 1980s pushed the number the same direction.
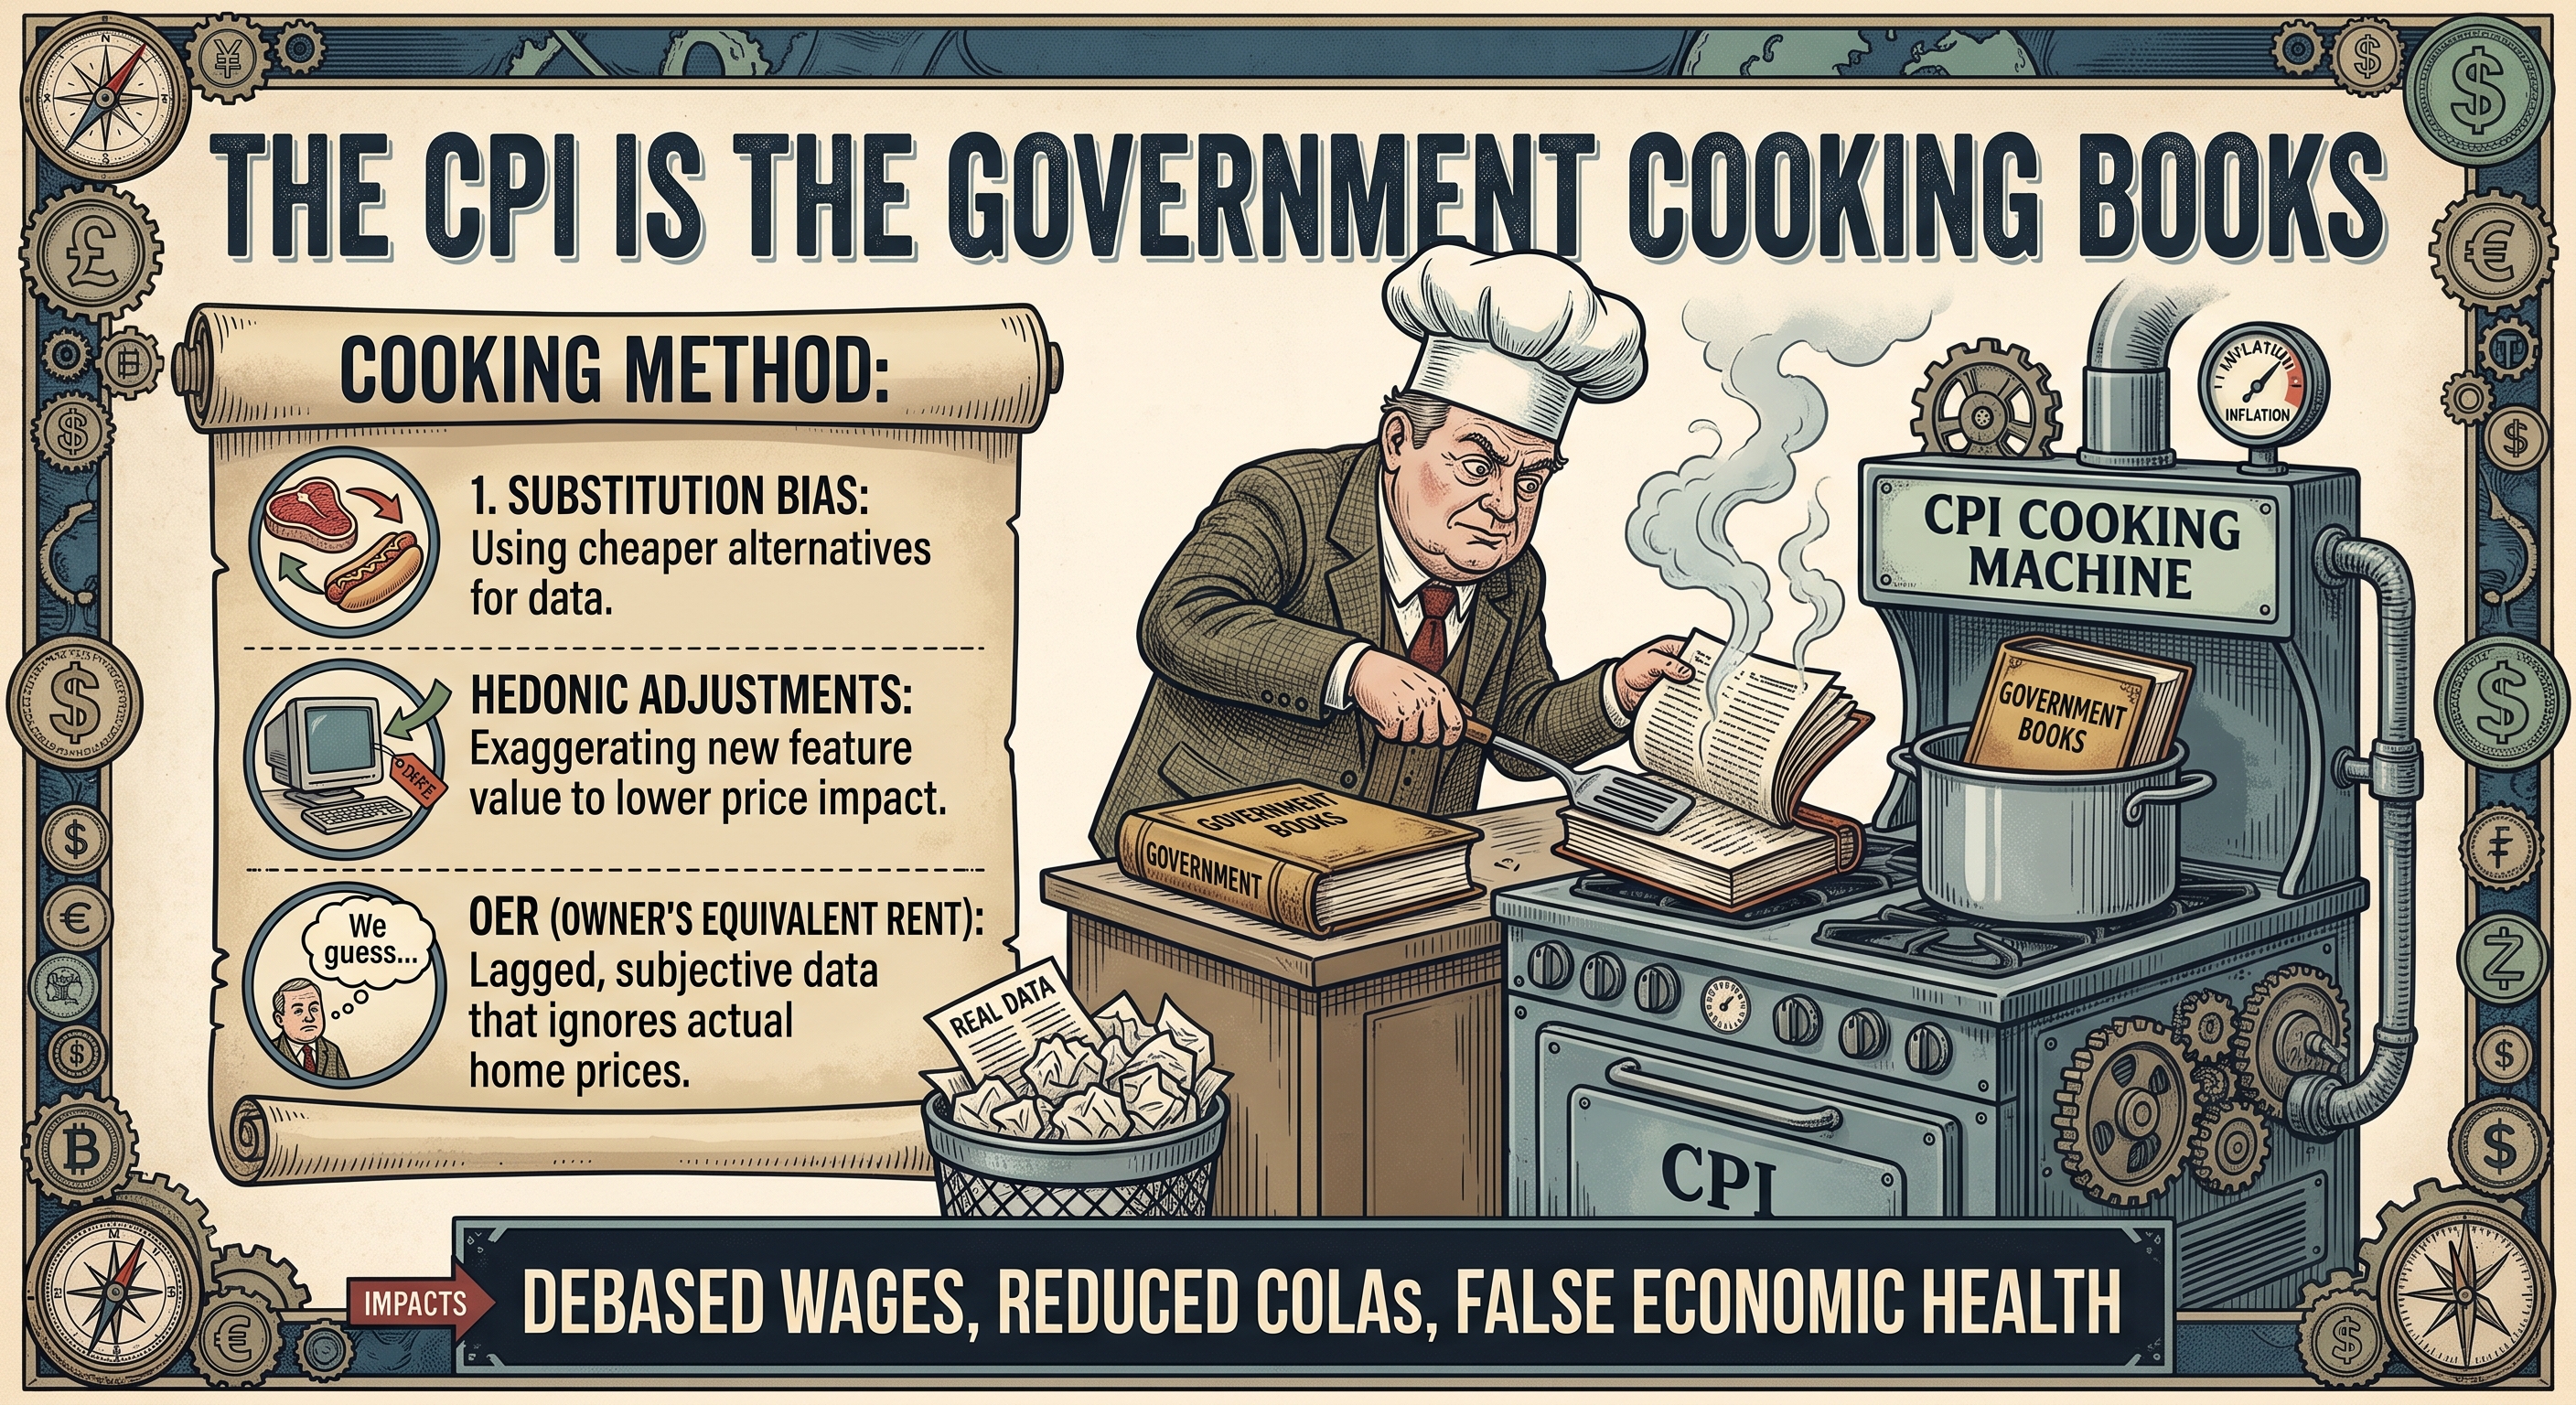
There is a gap between what the government reports for inflation and what people experience at the grocery store, the insurance renewal, and the closing table. That gap is not imagination, and it is not entirely explained by people being bad at estimating prices.
The Consumer Price Index is a constructed number, built on methodological choices, and those choices matter enormously. Here is what it actually measures, how it has changed, and why reasonable people question whether it captures reality.
CPI is a model, not a measurement
Start with the basic point. CPI does not simply add up what things cost. It applies a weighted basket, a set of quality adjustments, and a substitution assumption to produce a single index number.
Every one of those steps involves judgment. What goes in the basket, how it is weighted, how quality changes are valued, and how consumer behavior is modeled all shape the output. Change the methodology and you change the number, without a single price in the economy moving.
The three adjustments worth understanding
Substitution. The index assumes that when the price of something rises, consumers shift toward cheaper alternatives, and the calculation reflects that shift. In 1999, a geometric mean formula replaced the arithmetic mean for most components specifically to capture this.
The critique is straightforward. If beef gets expensive and you switch to chicken, your cost of living did not stay flat. Your standard of living fell. Substitution is a behavioral adaptation to inflation, not evidence that inflation did not occur, and treating it as neutral understates what households actually experience.
Hedonic quality adjustment. When a product improves, the index attributes part of any price increase to added quality rather than to inflation. Pay more for a car with better features and the index records less price increase than your bank account did.
The critique here is about asymmetry. Quality improvements are captured diligently. Quality declines, shrinkflation, worse service, less durable goods, are captured far less consistently.
Owners' equivalent rent. This is the big one for anyone in real estate. In 1983, the index stopped using actual house prices for owner-occupied housing and switched to an estimate of what homeowners would hypothetically pay to rent their own homes.
Shelter is roughly a third of the CPI basket, so this single choice carries enormous weight. And when home prices and mortgage costs rise faster than rents, which describes much of the last two decades, the index understates the housing inflation actual buyers face. A first-time buyer priced out by a 40 percent run-up in home prices does not care what the owners' equivalent rent series did.
The pattern that raises the eyebrow
Here is the observation that does not require alleging a conspiracy, and is harder to wave away because of it.
The methodology has been revised repeatedly since the 1980s. Owners' equivalent rent in 1983. The Boskin Commission's findings in 1996. Expanded hedonic adjustment beginning in the late 1990s. The geometric mean formula in 1999.
Each change was defended on technical grounds, and the defenses are not frivolous. But essentially every one of them pushed the reported number in the same direction: down. When a long series of independent technical corrections all happen to reduce the headline figure, it is reasonable to ask about the incentives behind the process.
And the incentives are not subtle. The government is the largest single beneficiary of a lower CPI print. CPI drives Social Security cost-of-living adjustments, federal benefit indexing, interest payments on inflation-protected securities, and the indexing of tax brackets. A persistently lower measured inflation rate saves the federal government an enormous amount of money and makes the fiscal picture look considerably better than it is.
You do not need to believe anyone is falsifying data. You need only notice that the entity that produces the number has a large and continuing financial interest in that number being low. In any other context we would call that a conflict of interest worth accounting for.
The fair counterargument
Honesty requires presenting the other side, and it has real substance.
The Bureau of Labor Statistics has responded to these criticisms directly and in detail. It argues that hedonic adjustment is applied to a relatively small portion of the total index, and notes that one of the largest hedonic applications, the aging adjustment for rental units, actually increases measured inflation rather than reducing it. It points out that owners' equivalent rent was recommended by an expert committee back in 1961 and is the most common approach used among developed countries, not an American invention. And it maintains that critics have overestimated the magnitude of these changes.
It is also worth noting that the most popular alternative inflation measures circulating online are not rigorous. Several essentially add a fixed adjustment to the official figure rather than independently measuring prices, and they are not credible substitutes.
The reasonable conclusion is not that CPI is fabricated. It is that CPI is a specific model with specific assumptions, that those assumptions systematically produce a lower number than a naive price comparison would, and that the institution producing it benefits from that result.
Why this matters if you own property
Two practical implications.
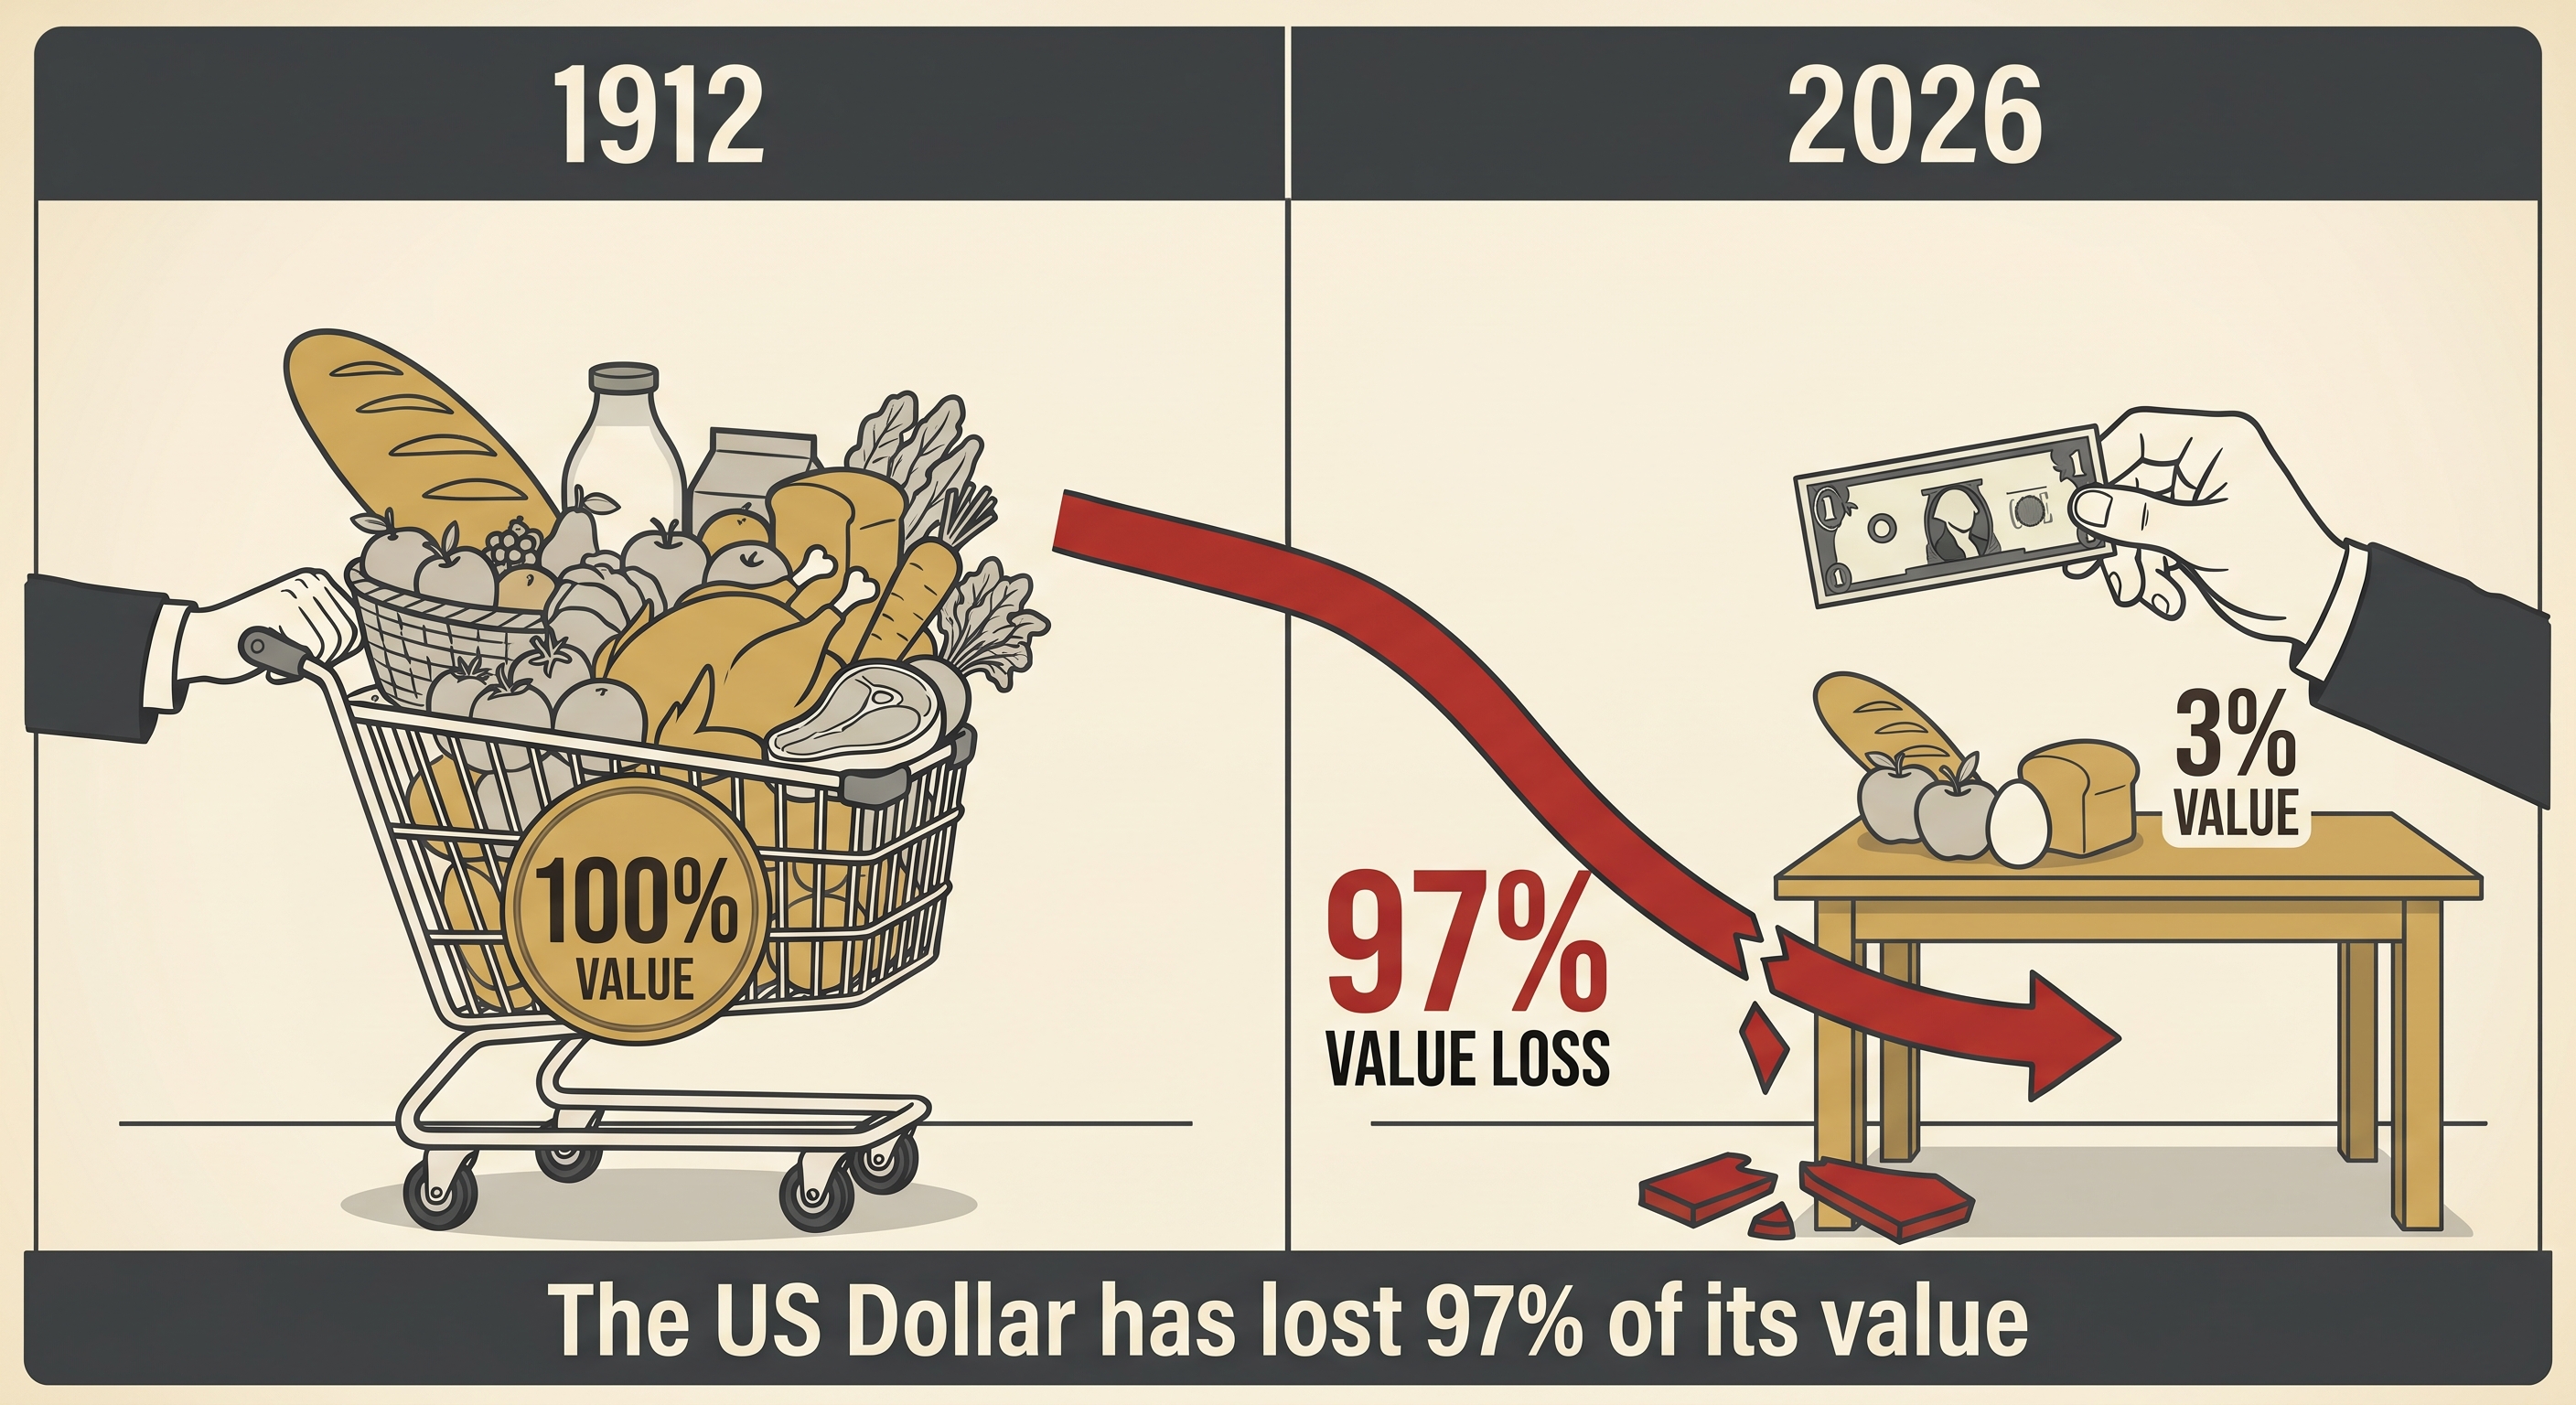
First, if official inflation understates real inflation, then every calculation built on it is off in the same direction. Real returns look better than they are. And the frequently cited figure that the dollar has lost roughly 97 percent of its purchasing power since 1913 is calculated using CPI itself. If CPI understates inflation, then the true erosion is worse than 97 percent.
Second, and more usefully, understated official inflation means the real cost of your fixed-rate mortgage is lower than the standard calculation suggests. If actual inflation runs above the reported figure, your real interest rate is lower than you think, and possibly negative. Fixed-rate debt against a hard asset is an even better position than the official numbers imply.
We are a real estate team, not economists, and this is a framework rather than financial advice. But we think property owners make better decisions when they understand that the yardstick is constructed and who constructed it.
If you want to know what your property is genuinely worth in today's market, we offer a complimentary professional valuation grounded in real comparable sales.
Call or text 713-303-5039.
The Keegan Group | Montgomery County, Texas / Residential · Commercial · Land · Investment · Property Tax Consulting.
More in Economic
2026-09-01
The Dollar Has Lost 97% of Its Value Since 1913. Here Is the Record.
CPI stood at 9.9 in 1913 and sits above 320 today. A 1913 dollar buys about three cents of what it bought then. The record, the 1971 hinge, and why 2 percent is a policy rather than an accident.

2026-09-01
Your Fixed-Rate Mortgage Is a Bet Against the Dollar, and That Is a Good Bet
Most people think of a mortgage as a burden. In an inflationary system it is mostly backwards. Your debt is fixed while the dollars repaying it shrink, and the asset behind it rises. Both forces work in your favor.

2026-09-01
Why Prices Are Not Going Back: The Case for Long-Term Real Estate Appreciation
People are waiting for prices to come back down. We think that wait is permanent, and the reason has less to do with housing than with money. The house did not change 2.7 times. The yardstick got shorter.
Ready to Discuss Your Needs?
Whether you're locally upgrading, relocating to the area, or expanding your business or investment portfolio, we're here to guide you with competence and precision.
Call or Text: 713-303-5039